Verify permissions, roles, and user features
Prerequisite(s)
Create the required clusters, work partitions, roles, and user resources.
- Log in to the console with the admin user
- Choose cluster management - cluster list module, create cluster A and cluster B respectively
- Choose cluster A and enter the Workspaces module to create Workspace A and Workspace B respectively.
- Workspace A: Enter the hostname a.test.com
- Workspace B: Enter the hostname b.test.com
- Enter the user management module and create user1, user2, user3, and user4.
- user1: Assign administrator roles to cluster A and cluster B
- user2: Assign the observer role to cluster B
- user3: Assign the administrator role of workspace A under cluster A
- user4: Assign the observer role of Workspace A and Workspace B under cluster A
Multi-tenant
Note: The account provided by the online POC is a single cluster administrator role. Please skip this verification step
Cluster resource isolation
- Use user1 to log in to the system;
- In the Cluster Management - Cluster List module, you can see cluster A and cluster B;
- Enter the consumer module of cluster B and create a consumer.
- Use user2 to log in to the system;
- In the Cluster Management - Cluster List module, only cluster B can be seen;
- In the Consumer module of cluster B, you can see the consumer created by user1, but can't edit, delete, or create;
Workspace resource isolation
- Use user3 to log in to the system;
- In the cluster management - cluster list module, only cluster A can be seen;
- Enter the Workspaces module of cluster A, only Workspace A can be seen;
- Enter Workspace A and create an API resource.
- Use user4 to log in to the system;
- In the Cluster Management - Cluster List module, only cluster A can be seen;
- Enter the Workspaces module of cluster A, you can see the workspace A and B;
- Enter workspace A, you can see the API created by user1, but it can only be viewed, not edited, deleted, or created;
- Enter workspace B without any API resources and cannot create API resources.
Admin user has full permissions
- Use the admin user to log in to the system;
- In the Cluster Management - Cluster List module, you can see cluster A and cluster B;
- Enter the Workspaces module of cluster A, you can see the workspace A and B;
- Enter workspace A, and you can see the API resources created by user1, you can create, edit and delete operations;
- Enter workspace B, you can create, edit, and delete operations.
Verify API publishing capability
- Use admin user to log in to the system;
- Enter workspaceA;
- Enter the Upstream management module and create an upstream:
- Go to the API management module and create a route:
- Once created, verify as follows:
# 1. Get the gateway IP

# 2. Calling the API, the gateway will forward the request to the upstream service httpbin.org according to parameters such as Host and URI

$ curl IP:PORT/get -H "Host: a.test.com"

# 3. Return upstream data normally, complete verification
Verify API access authentication capability
Use basic-auth
- Use admin user to log in to the system;
- Access the Consumer module, create a consumer, and enable the basic-auth plugin;
- Access the workspace module and enter workspace A;
- Visit API - > Plugin Template, and click the Create;
- Select the basic-auth plugin in the plugin list, submit and create after clicking Enable;
- Visit API - > List to edit the API created by the previous verification step;
- Select the plugin template you just created and submit the update;
- Once created, verify:
# Without authentication information, return 401
$ curl -i IP:PORT/get -H "Host: a.test.com"
HTTP/1.1 401 Unauthorized

# User doesn't exist, returns 401
$ curl -i -u foo:foo IP:PORT/get -H "Host: a.test.com"
HTTP/1.1 401 Unauthorized

# The entered password is incorrect, return 401
$ curl -i -u user1:foo IP:PORT/get -H "Host: a.test.com"
HTTP/1.1 401 Unauthorized

# The correct username and password, returns 200
$ curl -i -u user1:password1 IP:PORT/get -H "Host: a.test.com"
HTTP/1.1 200 OK
Verify upstream load balancing capability
Upstream one node/multiple nodes, hostname
- Use admin user to log in to the system;
- Enter the workspace and create an upstream service:
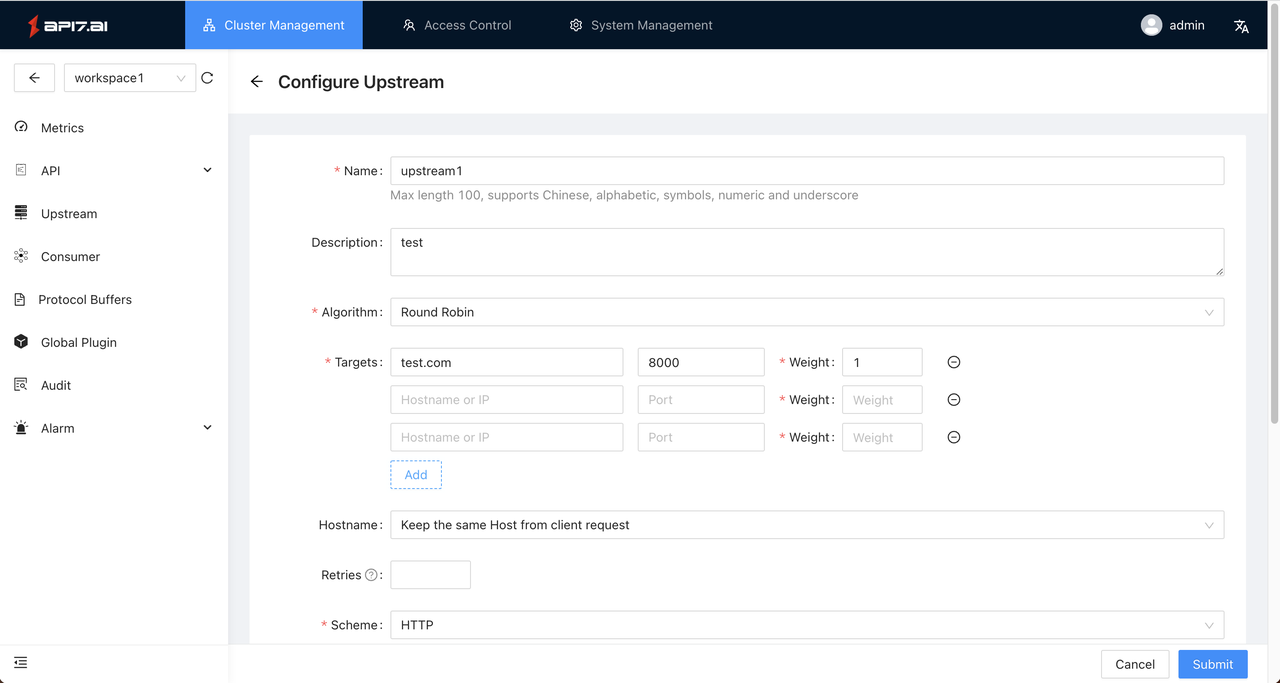
- You can enter one or more upstream nodes (IP or hostname) and set different weights.
- Verification: By setting weights for different upstream nodes, it can be found that requests will be allocated to different nodes according to the proportion of weights.
Verify the limit rate of the gateway
- Use admin user to log in to the system;
- Create a plugin template and enable the limit-count plugin:
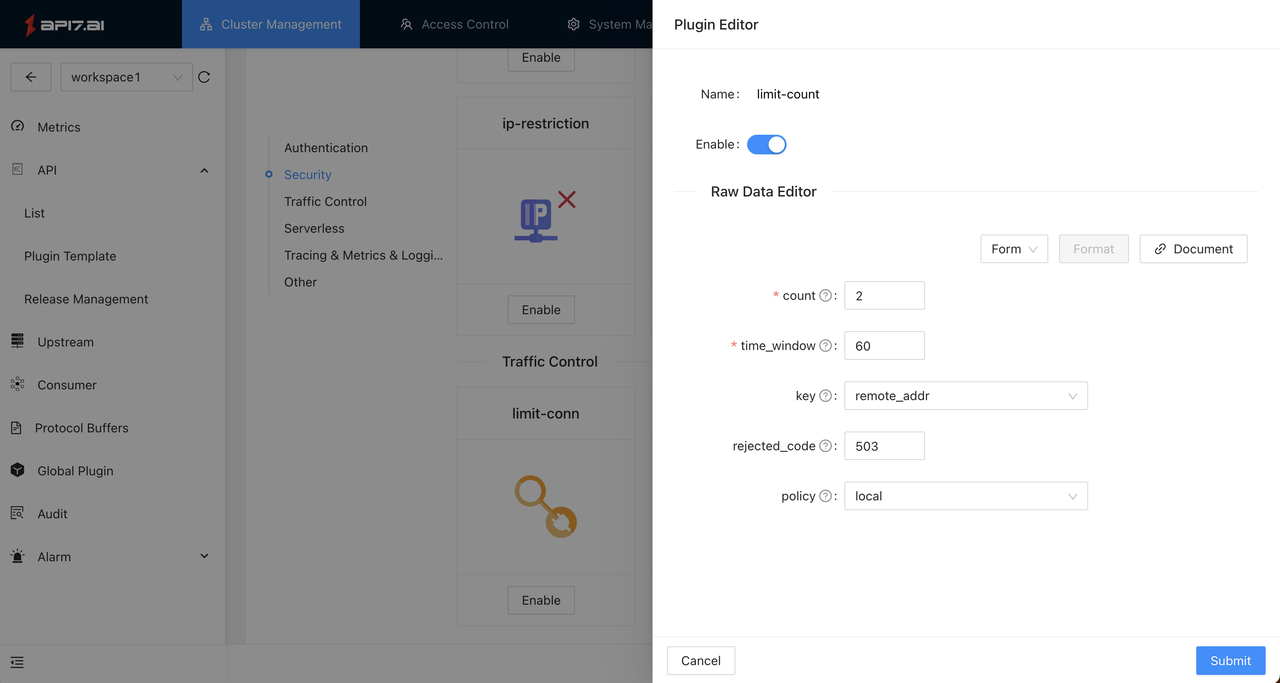
- The above configuration indicates that if more than 2 requests with the same remote_addrare accessed within a time window (the 60s), the gateway will return a 503 status code.
- Verification: Access routes within the 60s:
# 1st visit (use the actual deployment gateway IP and port number):
## Request
$ curl -i http://127.0.0.1:9080/get
## Response
...
HTTP/1.1 200 OK
X-RateLimit-Limit: 2
X-RateLimit-Remaining: 1
...
# 2nd visit:
## Request
$ curl -i http://127.0.0.1:9080/get
## Response
...
HTTP/1.1 200 OK
X-RateLimit-Limit: 2
X-RateLimit-Remaining: 0
...
# 3rd visit:
## Request
$ curl -i http://127.0.0.1:9080/get
## Response
...
HTTP/1.1 503 Service Temporarily Unavailable
...
Verify API canary release capability
- Use admin user to log in to the system;
- Enter workspaceA and create a new upstream: upstream2;
- Go to API -> Release Management and create a release task:
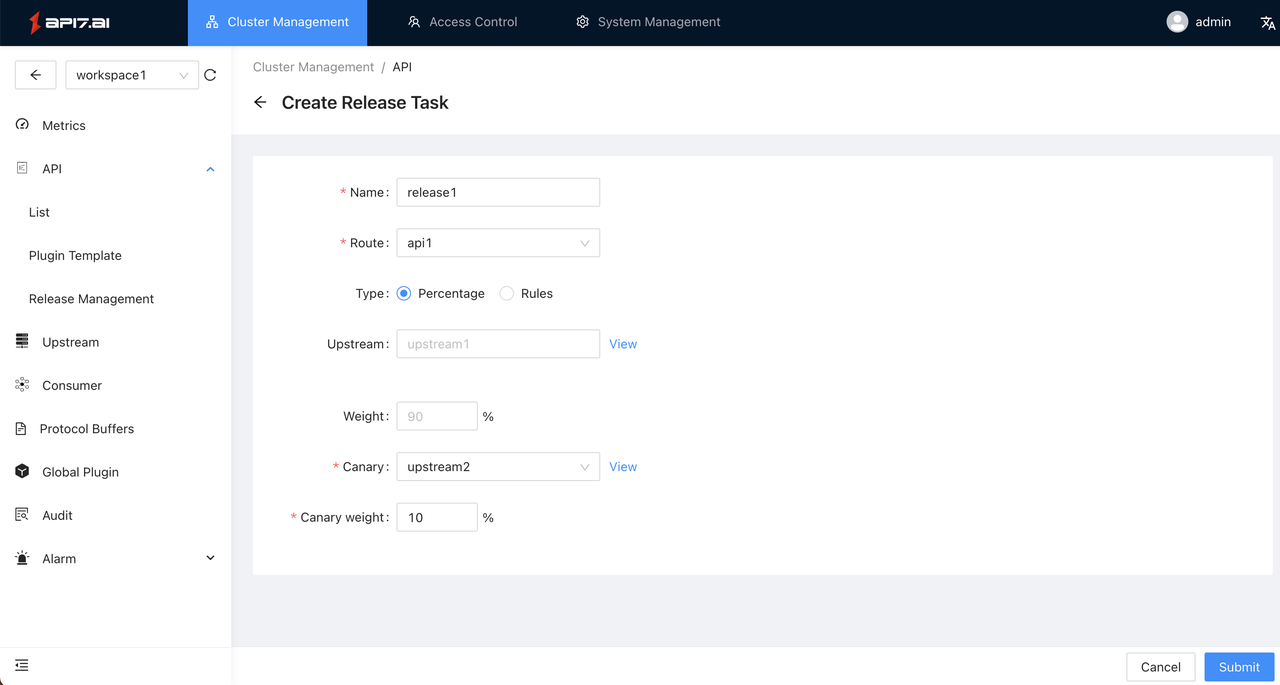
- After selecting the API, select the target upstream service (upstream2) and allocate 10% of the traffic to upstream2;
- Verify that upstream2 is canary released: continuously access the API, and you will find that 10% of the requests are made to upstream2;
- When the grayscale upstream verification is passed, select API -> Release Management -> More -> Full Release, and use upstream2 as the new upstream service of the API.
Verify API alarm management capability
- Use admin user to log in to the system; Enter workspaceA;
- Access the Global Plugin and enable the Prometheus plugin, so that Prometheus monitoring is enabled for any API in WorkspaceA. If you only need to monitor for a few APIs, you can bind Prometheus plugins for only specified APIs;
- Access Alarm -> Alarm Notification -> Create, and refer to the following example to create a new template:
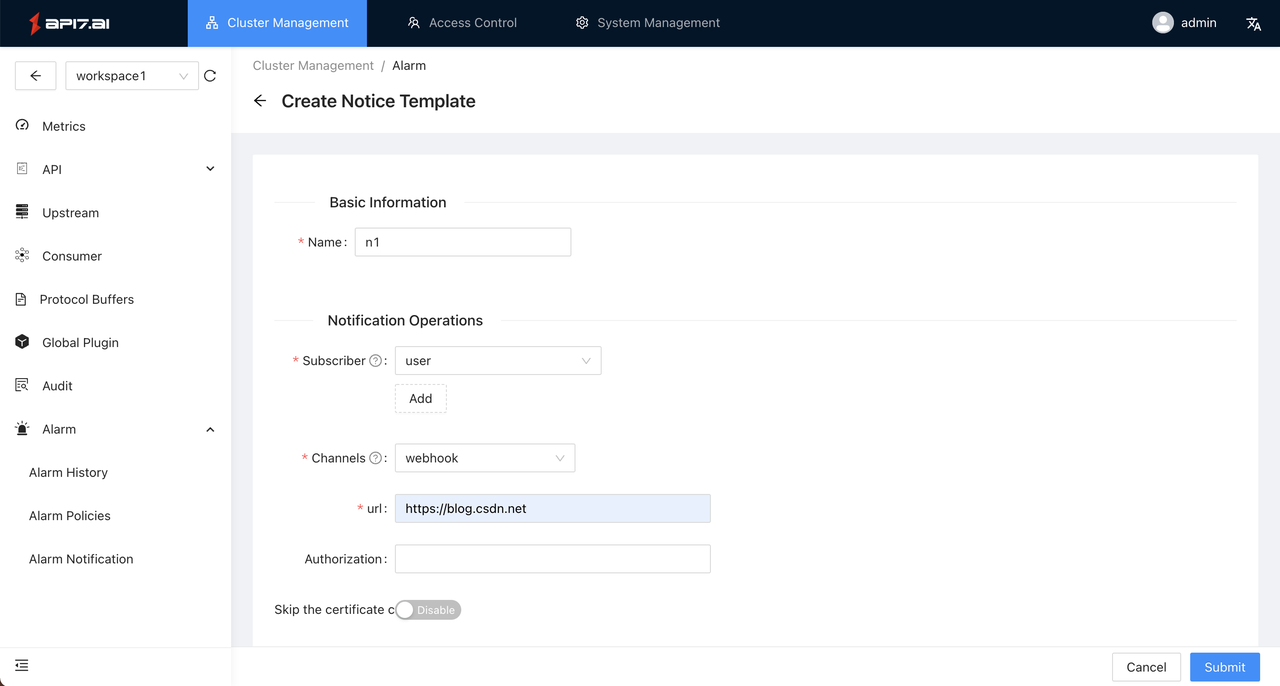
Parameter description:
- Subscriber: When the alarm is triggered, the system will send data to the specified Webhook, and the data will contain the specified subscription username for use by the three-party system (for example: notify the specified user in the form of an inbox notification);
- Channels: When the alarm is triggered, how to notify the user, and Webhook are currently supported. In this scenario, we use https://webhook.site for testing, which automatically generates Webhook addresses.
- Visit Alarm -> Alarm Policies -> Create and create an alarm rule with the following example: Parameter description:
- Target: refers to the object that needs to be monitored, optional: cluster, workspace, this example is the current workspace;
- Level: After receiving the data, the Webhook receiver can perform special processing according to the alarm level, such as selecting a different notification channel;
- Notice Template: Select the notification template created in the previous step. When the alarm triggers, a notification will be sent to the specified Webhook; In this example, we set up an alarm rule: within 1 minute, the number of requests with status code 503 is greater than 0, and if there is no recovery, the alarm is triggered every minute.
- Access the interface to trigger an alarm (verification):
curl  http://40.73.118.104/get -H "Host: test.com" -i
HTTP/1.1 503 Service Unavailable
...
Since the rules are set to listen for 503 requests, when the route in workspace A is hit and the 503 status code is returned, an alarm can be triggered. 6. Webhook receives data After a few seconds, Prometheus collects the metrics and generates an alert to notify Alertmanager that after Alertmanager calls back the Webhook, a callback request can be received in the https://webhook.site/. The callback request is a POST method, and the callback Body data is as follows:
{
        "origin_data": {
                "alerts": [{
                        "annotations": {
                                "description": "",
                                "summary": ""
                        },
                        "endsAt": "0001-01-01T00:00:00Z",
                        "generatorURL": "http://prometheus-58b5ccccd9-zbwnr:9090/graph?g0.expr=sum%28increase%28apisix_http_status%7Bcode%3D~%224..%22%2Cworkspace_id%3D%22360426034228691735%22%7D%5B1m%5D%29%29+%3E+0\u0026g0.tab=1",
                        "labels": {
                                "alarm": "365739596253823802__360426034228691735",
                                "alertname": "test-alarm",
                                "condition": "all",
                                "monitor": "codelab-monitor"
                        },
                        "startsAt": "2021-07-29T02:56:42.589Z",
                        "status": "firing",
                        "fingerprint": "4331c98b9a3a9305"
                }],
                "commonAnnotations": {
                        "description": "",
                        "summary": ""
                },
                "commonLabels": {
                        "alarm": "365739596253823802__360426034228691735",
                        "alertname": "test-alarm",
                        "condition": "all",
                        "monitor": "codelab-monitor"
                },
                "externalURL": "http://alertmanager-54cc7b9f8f-s5m8x:9093",
                "groupLabels": {},
                "receiver": "api7-dashboard",
                "status": "firing",
                "version": "4",
                "groupKey": "{}/{alarm=\"365739596253823802__360426034228691735\",condition=\"all\"}:{}"
        },
        "title": "A gateway monitoring alarm is triggered",
        "message": "API Gateway-Workspace A|Status code 503 Statistics greater than 0",
        "time": "2021-07-29 02:56:43.669363928 +0000 UTC"
}
- End of alarm After another minute, since the 4xx request did not fire, Alertmanager will send another callback to notify that the alarm has been lifted. Example data is as follows:
{
  "origin_data": {
    "alerts": [
      {
        "annotations": {
          "description": "",
          "summary": ""
        },
        "endsAt": "2021-07-29T02:57:41.589Z",
        "generatorURL": "http://prometheus-58b5ccccd9-zbwnr:9090/graph?g0.expr=sum%28increase%28apisix_http_status%7Bcode%3D~%224..%22%2Cworkspace_id%3D%22360426034228691735%22%7D%5B1m%5D%29%29+%3E+0&g0.tab=1",
        "labels": {
          "alarm": "365739596253823802__360426034228691735",
          "alertname": "test-alarm",
          "condition": "all",
          "monitor": "codelab-monitor"
        },
        "startsAt": "2021-07-29T02:56:42.589Z",
        "status": "resolved",
        "fingerprint": "4331c98b9a3a9305"
      }
    ],
    "commonAnnotations": {
      "description": "",
      "summary": ""
    },
    "commonLabels": {
      "alarm": "365739596253823802__360426034228691735",
      "alertname": "test-alarm",
      "condition": "all",
      "monitor": "codelab-monitor"
    },
    "externalURL": "http://alertmanager-54cc7b9f8f-s5m8x:9093",
    "groupLabels": {},
    "receiver": "api7-dashboard",
    "status": "resolved",
    "version": "4",
    "groupKey": "{}/{alarm=\"365739596253823802__360426034228691735\",condition=\"all\"}:{}"
  },
  "title": "The gateway monitoring alarm has been recovered",
  "message": "API Gateway-Workspace A|Status code 503 Statistics greater than 0",
  "time": "2021-07-29 02:57:43.662826703 +0000 UTC"
}
- To view the data of the alarm history, visit Alarm Management - Alarm History.