Monitoring Reports
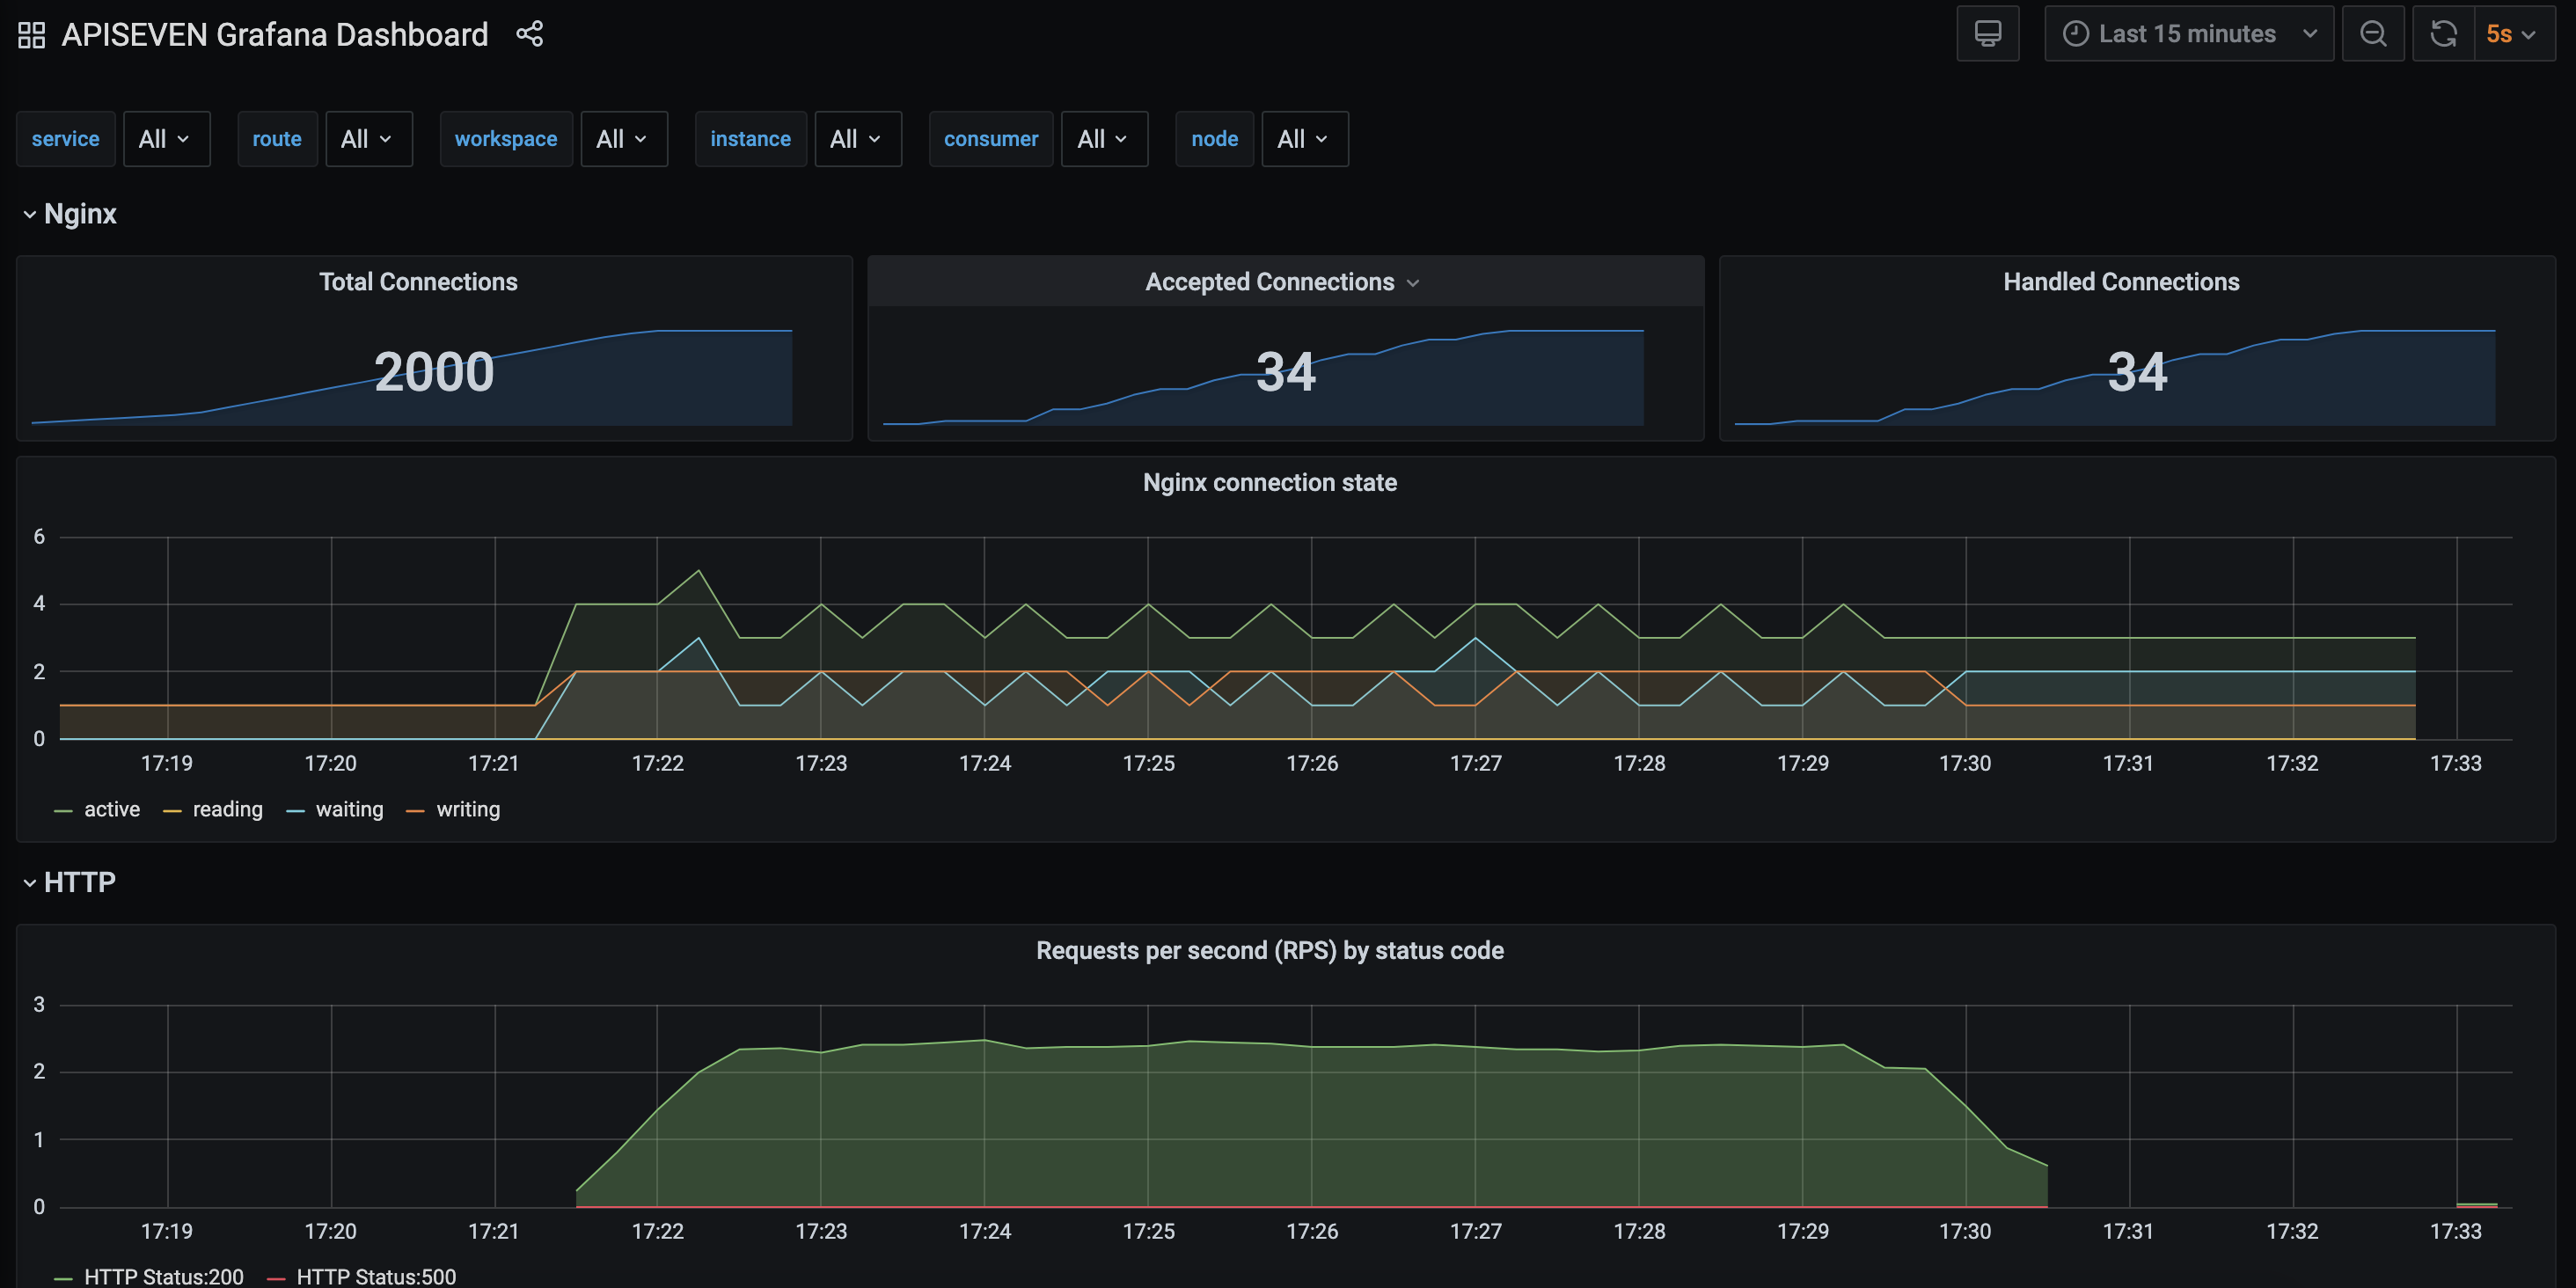
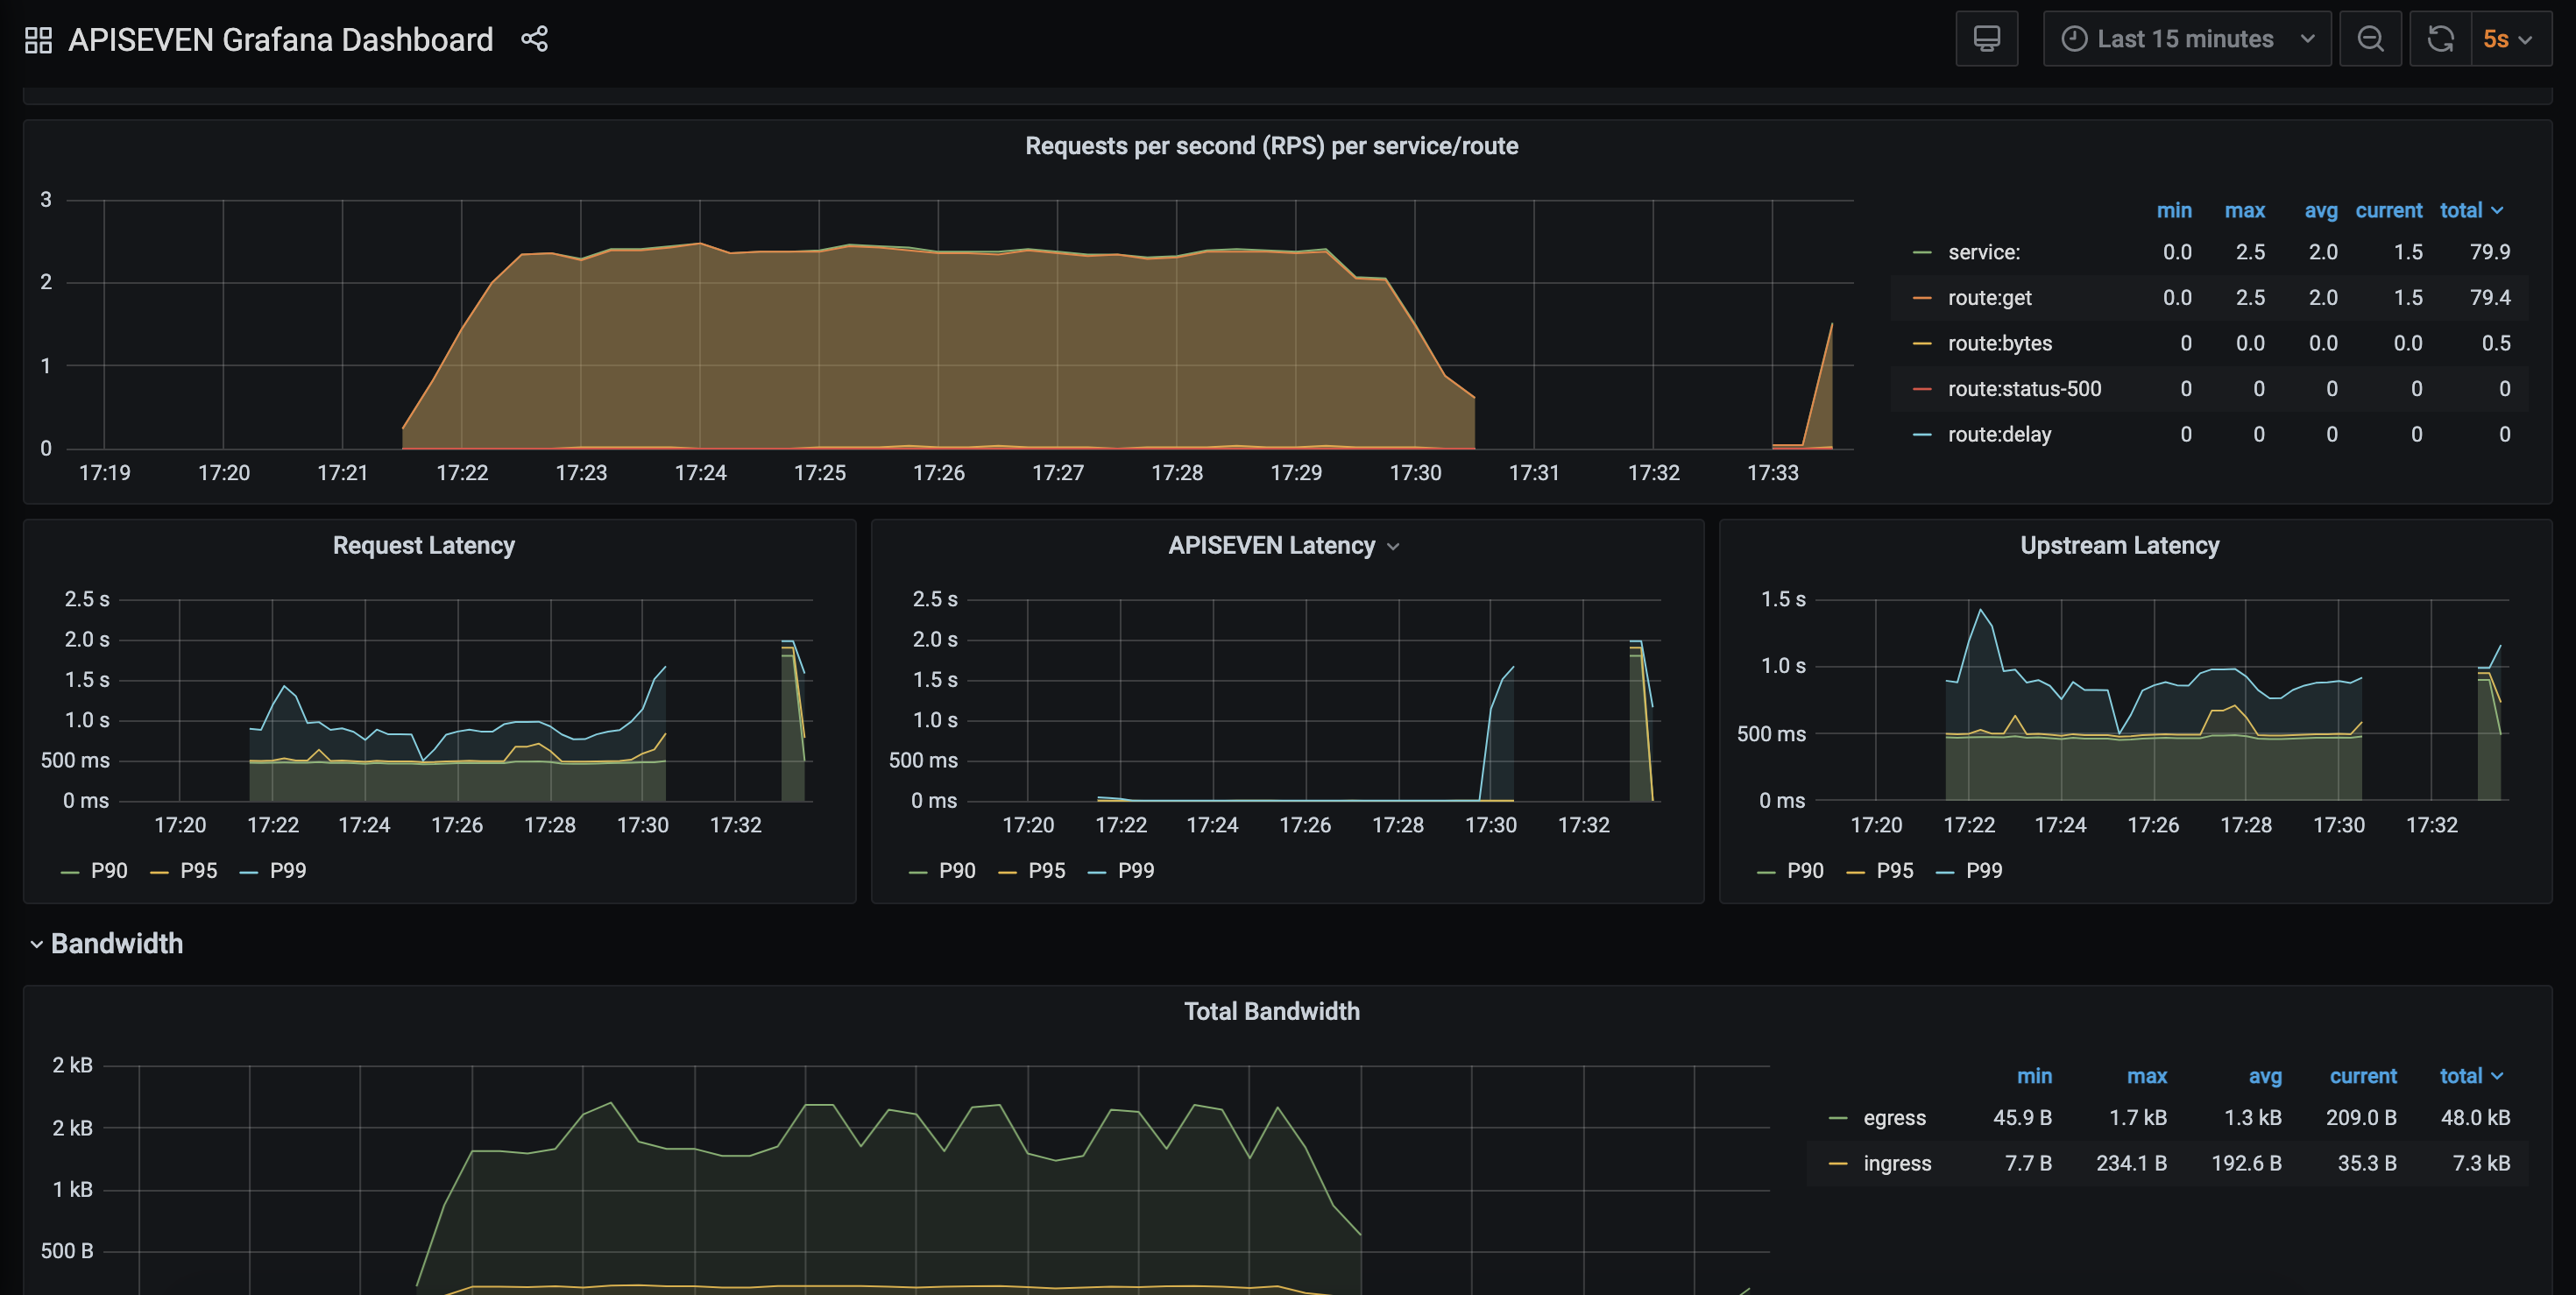
You can quickly understand the routing situation under the current cluster on the monitoring page, which includes the following indicators:
- Number of API calls;
- API average latency;
- API error rate;
- Hotspot API (Top5);
- Hot consumer information (Top5);
- Distribution of API status codes;
- ...
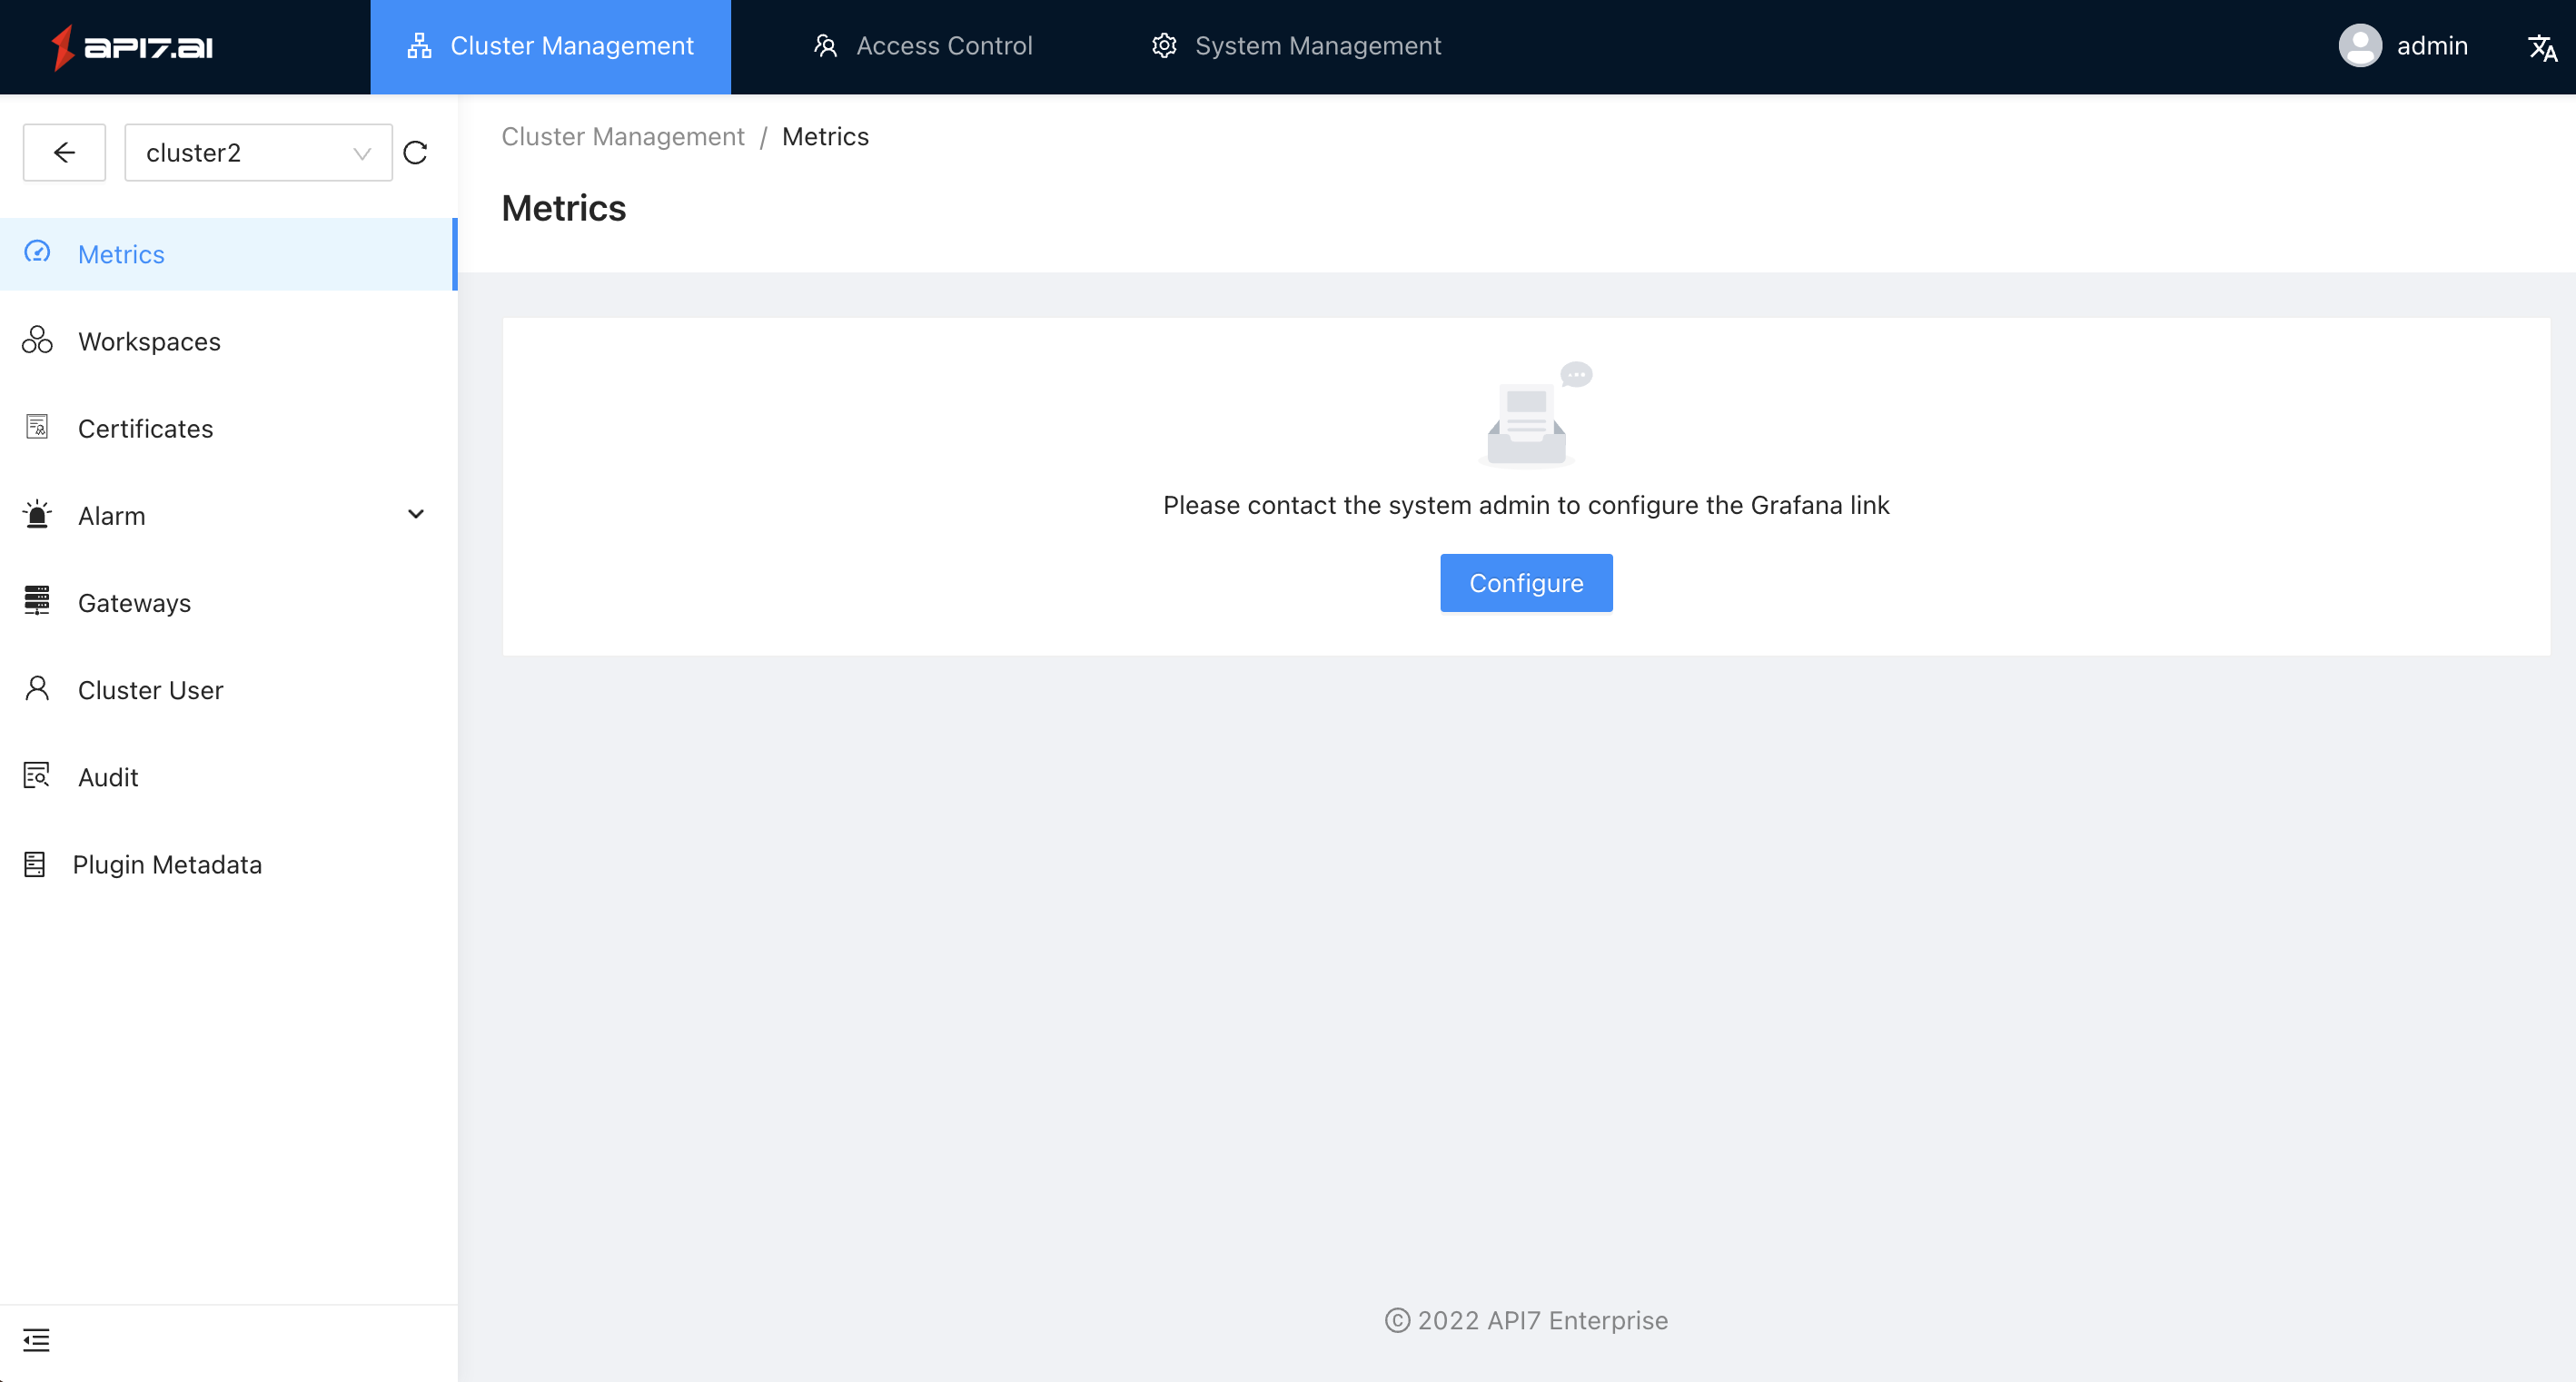
How to use it
Verify that the following services have started and can get data normally:
| Service | Start |
|---|---|
| API7-Gateway | Successfully started |
| Promethus | Can successfully get the data of API7-Gateway (you can see the API7-Gateway node on the API7-Dashboard gateway node page) |
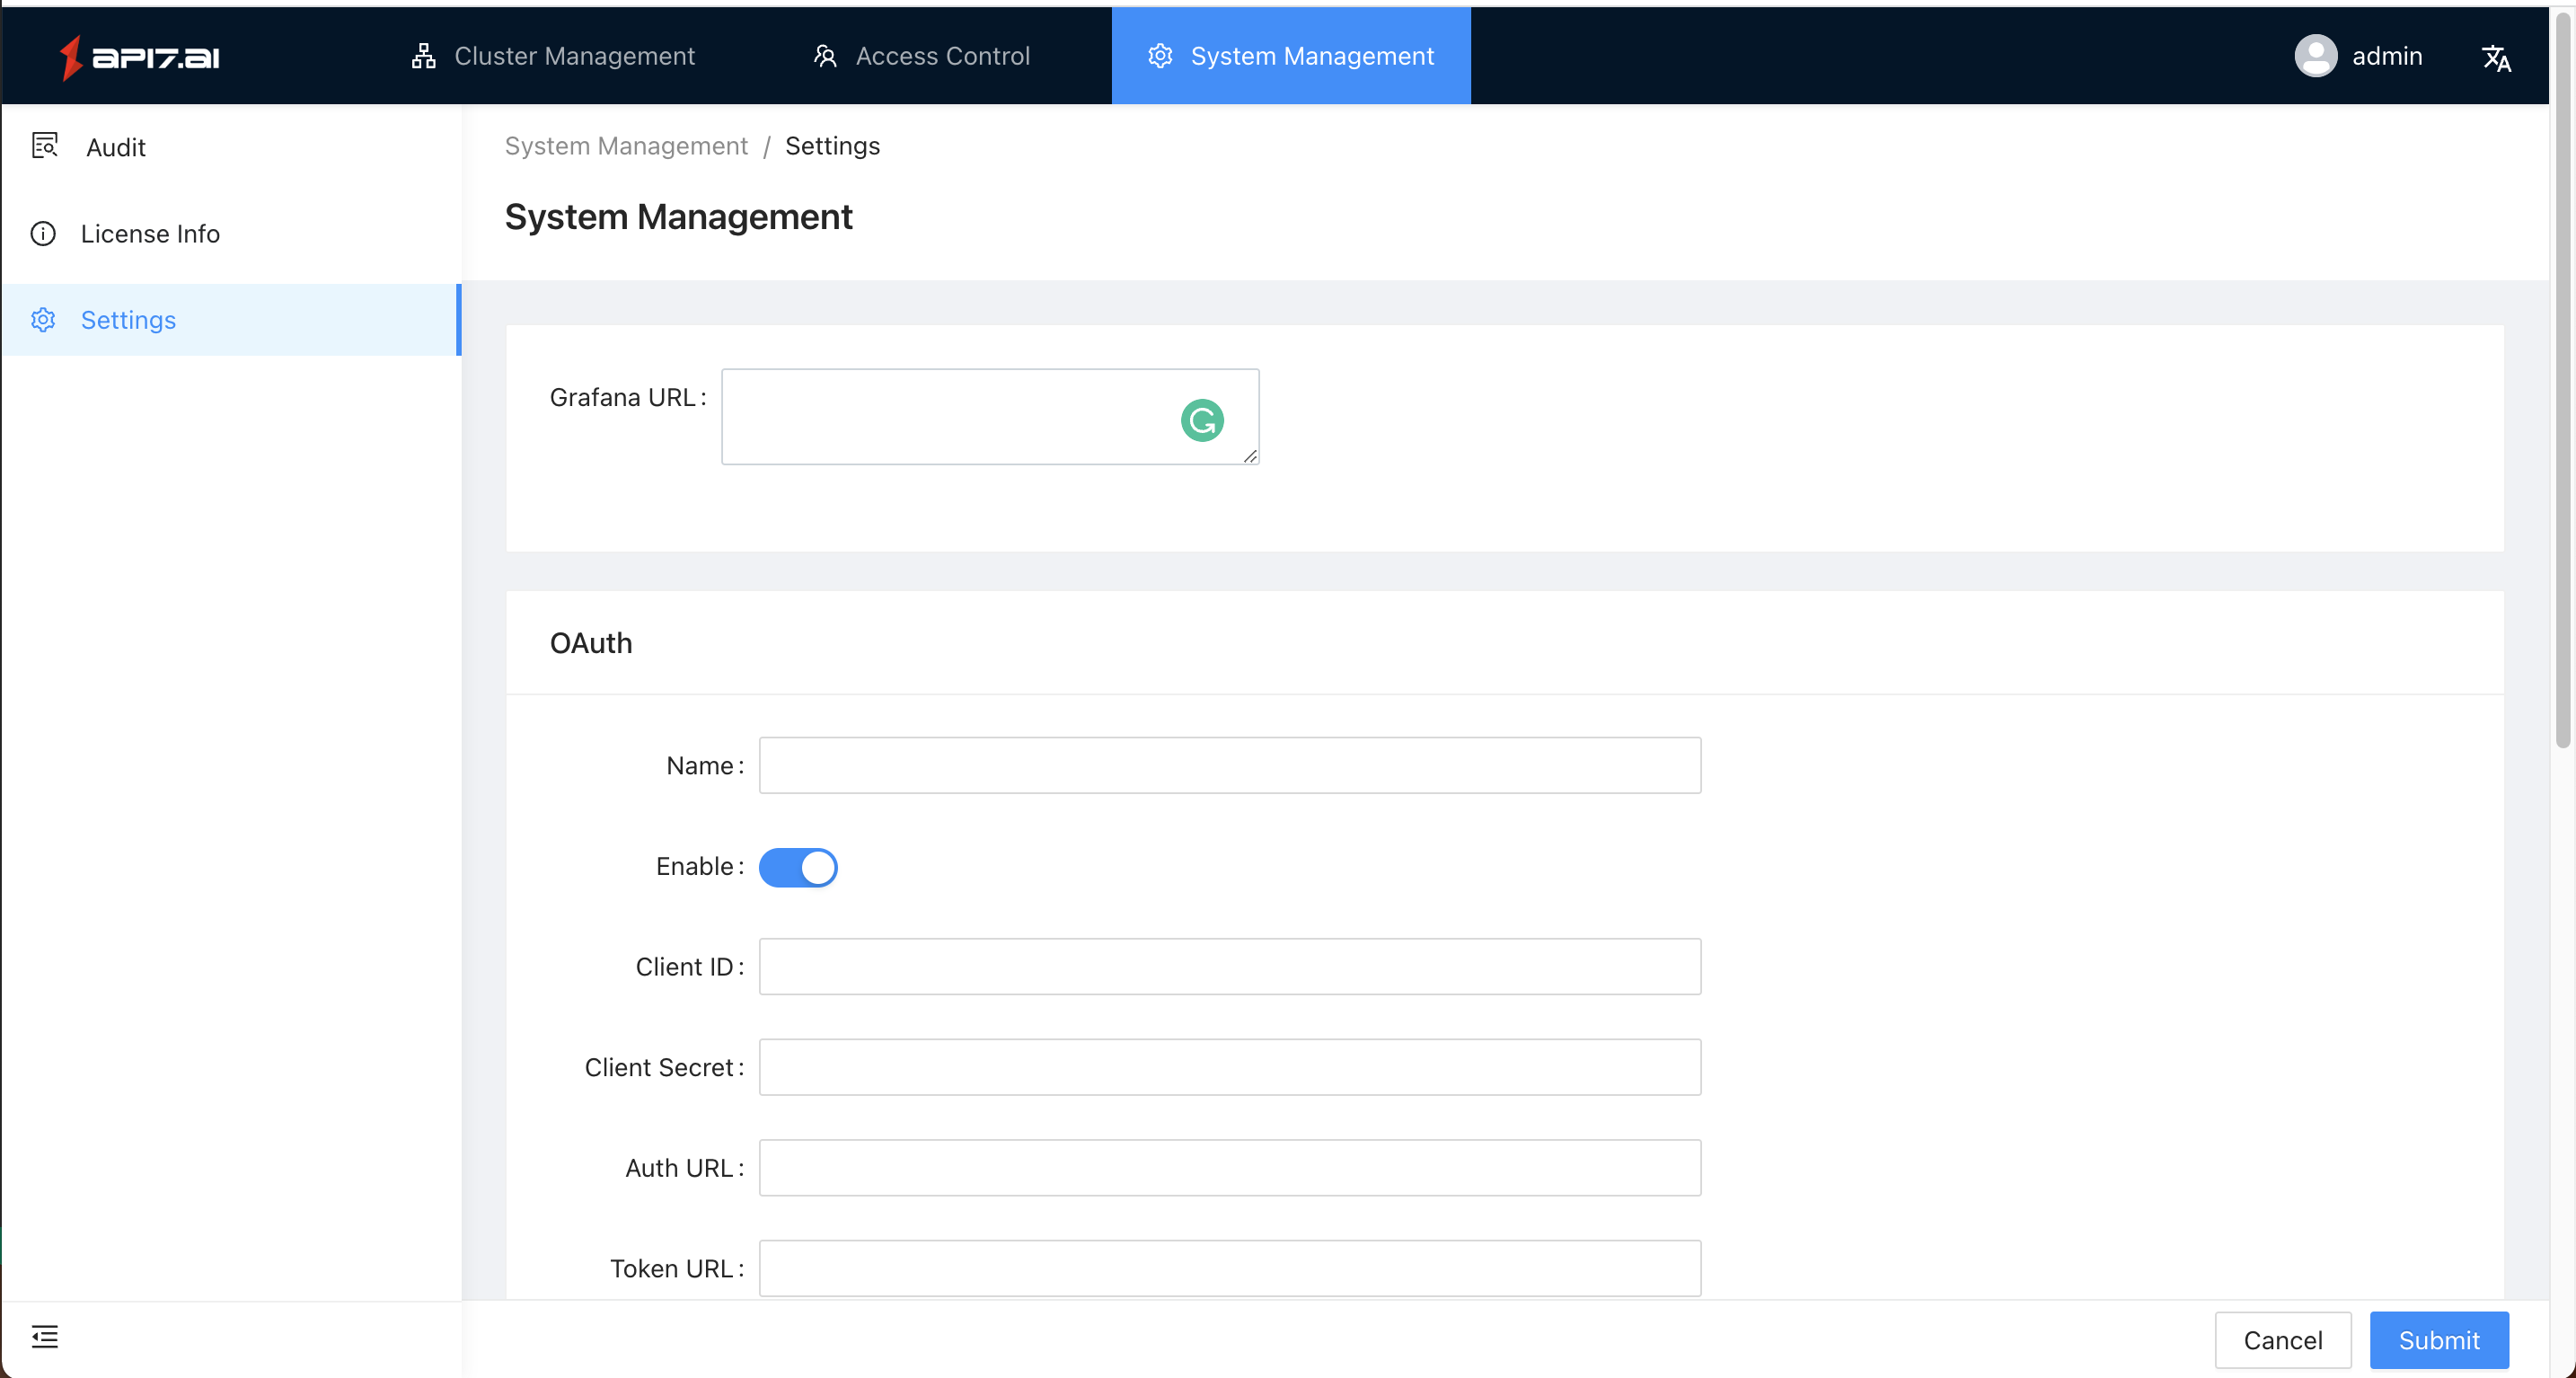
Step 1: Adjust the Grafana configuration
Modify the Grafana configuration to confirm that embedding is allowed.
[security]
allow_embedding = true
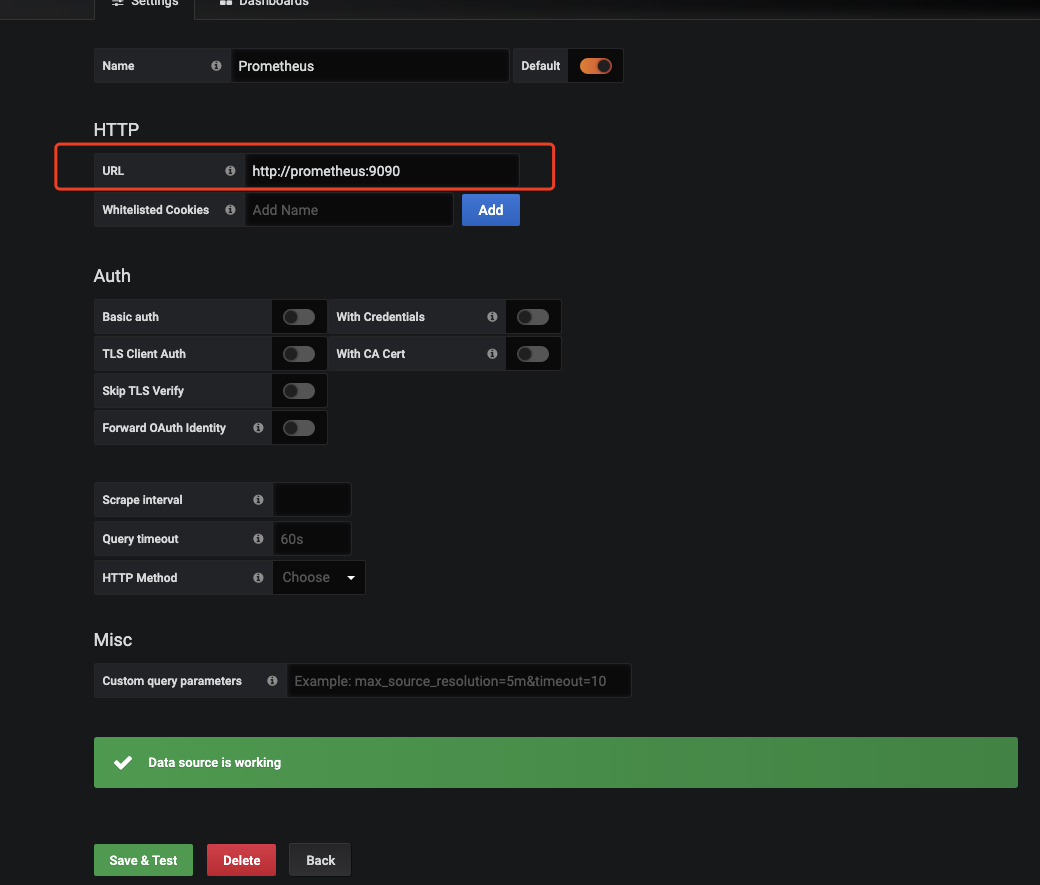
Step 2: Generate the Grafana panel
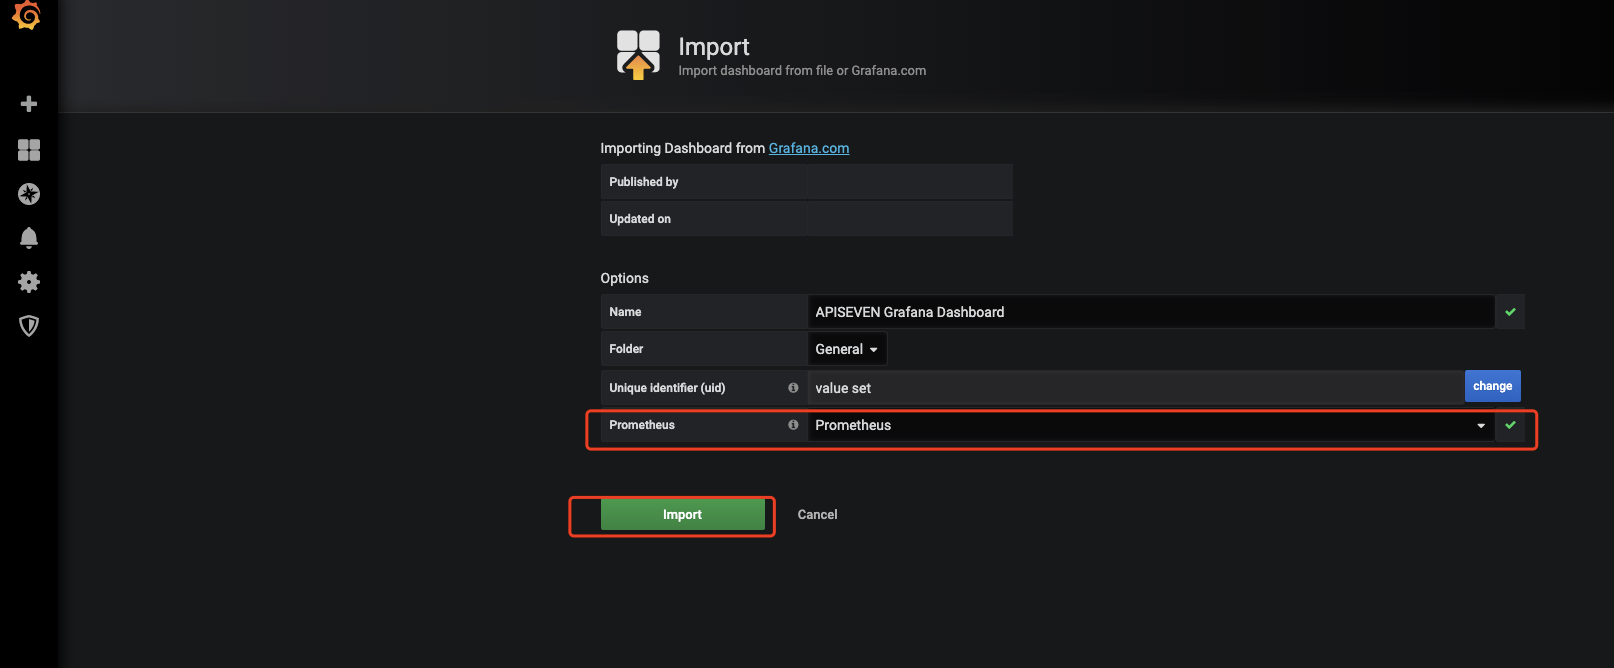
- Configure the Grafana data source for Prometheus
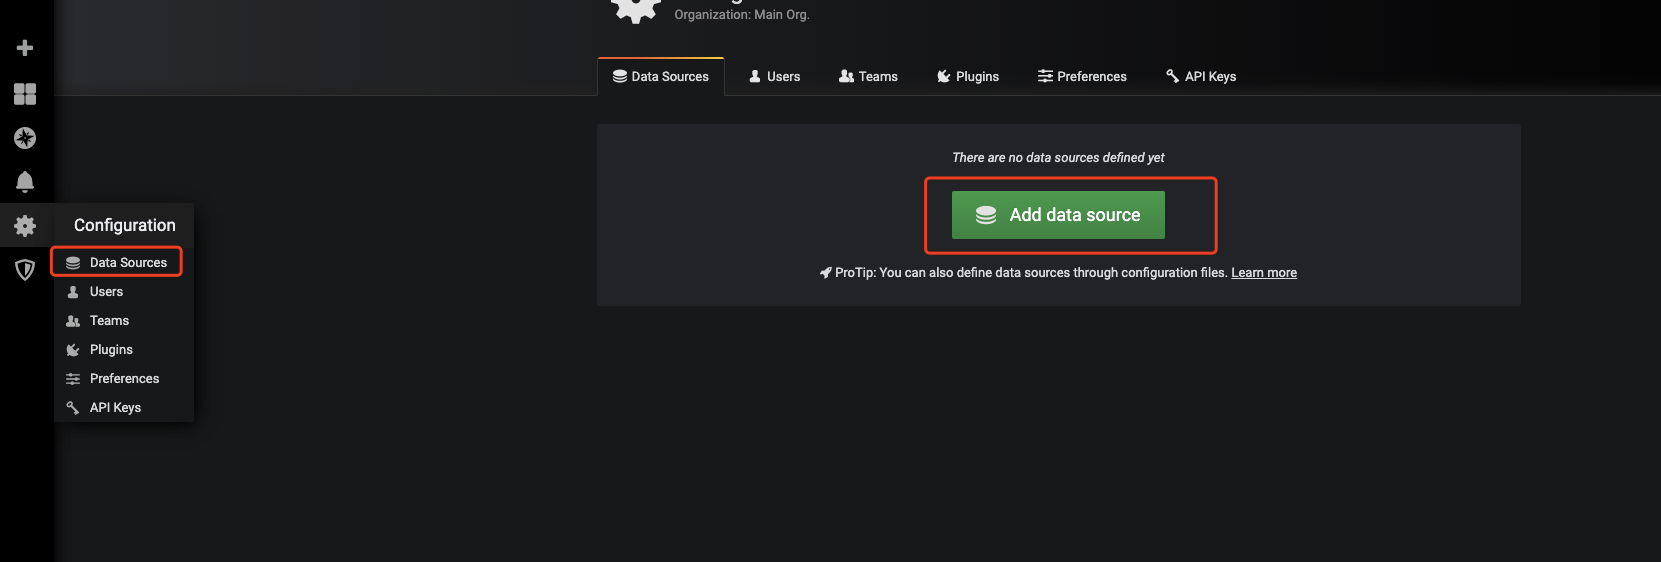
- Fill in the access address of prometheus
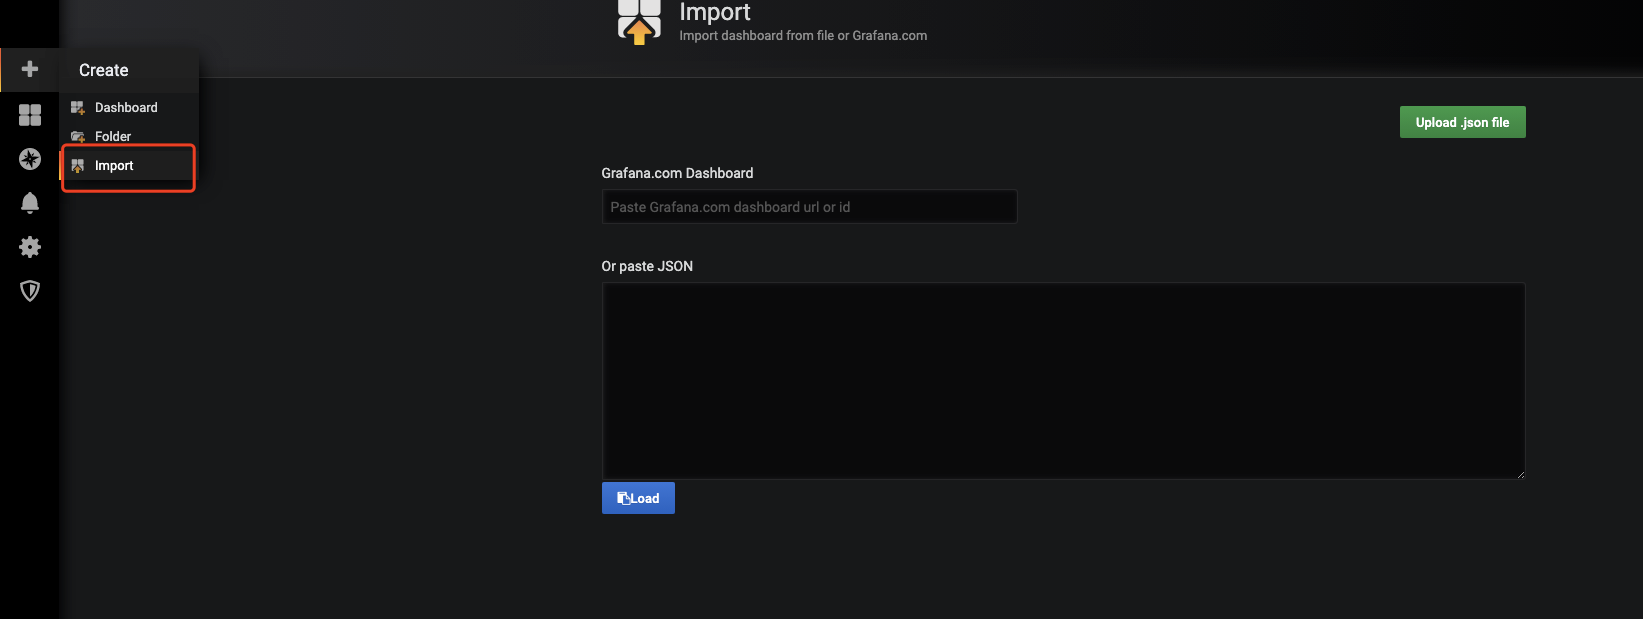
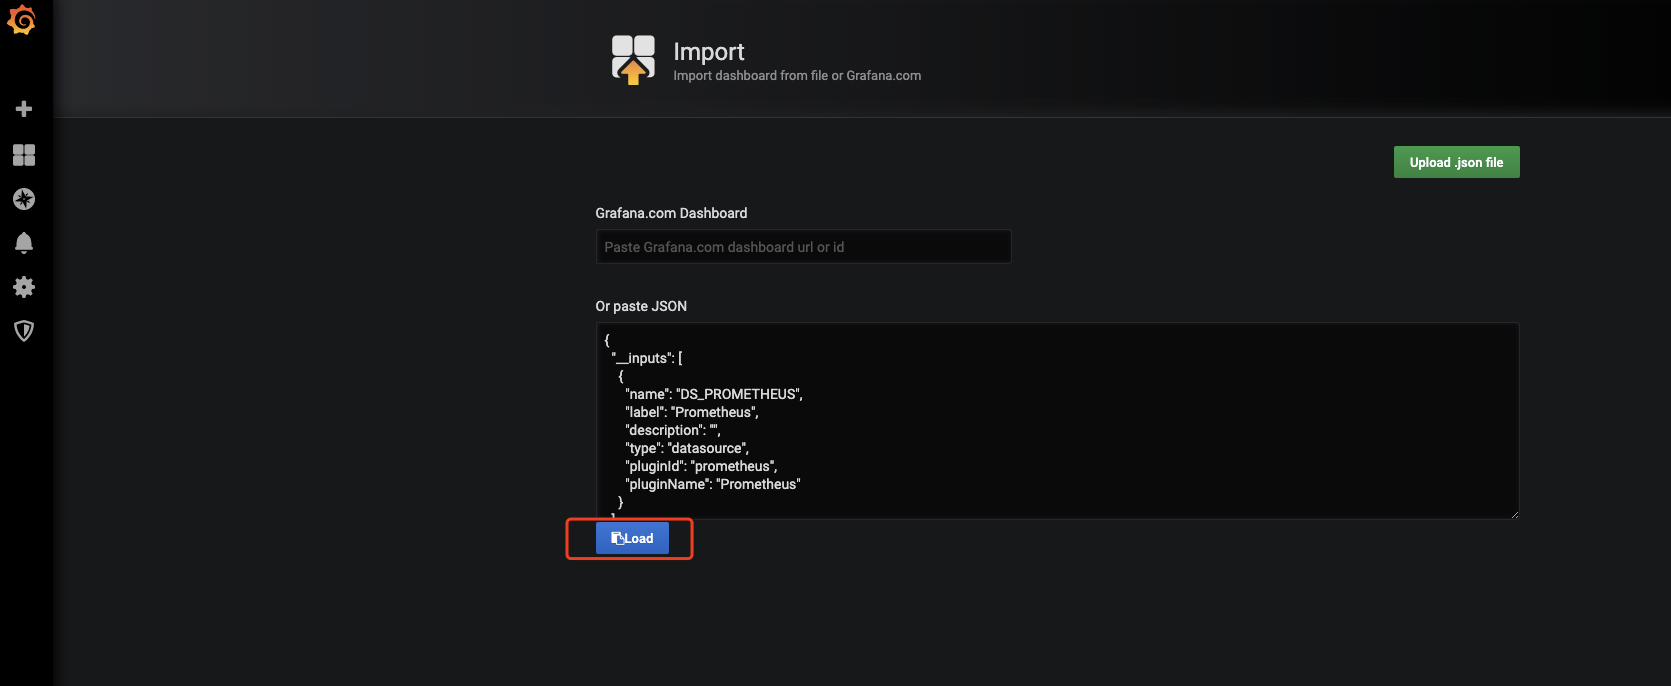
- Configure Dashboard
https://github.com/api7/api7/tree/master/docs/assets/other/json
Select the corresponding file content to upload, or fill in.
Step 3: Embed the Grafana panel
Fill in the Dashboard link address in the Grafana URL in the API7-Dashboard