# 使用 Prometheus 监控 APISIX 指标
Prometheus 是一种常用的系统监控和告警工具包。它收集并存储多维时间序列数据,例如带有键值对标签的指标。
APISIX 能够[以低延迟](https://api7.ai/blog/1s-to-10ms-reducing-prometheus-delay-in-api-gateway)向 Prometheus 公开大量指标,从而支持持续监控和诊断。
本指南介绍如何启用 [`prometheus`](https://docs.apiseven.com/hub/prometheus.md) 插件,与 Prometheus 和 Grafana 服务集成,以收集并可视化 APISIX HTTP 指标。

## 前置条件[](#前置条件 "前置条件的直接链接")
* 安装 [Docker](https://docs.docker.com/get-docker/)。
* 安装 [cURL](https://curl.se/) 以向服务发送验证请求。
* 按照[快速入门教程](https://docs.apiseven.com/apisix/getting-started.md)在 Docker 中启动新的 APISIX 实例。
* 如果使用 Admin API 示例且启用了身份验证,请将管理员角色的密钥导出为 `ADMIN_API_KEY`。请在 `deployment.admin.admin_key` 下配置该密钥。Docker 快速入门为了便于本地评估而禁用了身份验证;生产环境中请保持启用。
## 启用 Prometheus 插件[](#启用-prometheus-插件 "启用 Prometheus 插件的直接链接")
全局启用 `prometheus` 插件。你也可以仅在某个路由上启用该插件。
* Admin API
* ADC
```
curl "http://127.0.0.1:9180/apisix/admin/global_rules/prometheus" -X PUT \
-H "X-API-KEY: ${ADMIN_API_KEY}" \
-H "Content-Type: application/json" \
-d '{
"plugins": {
"prometheus": {}
}
}'
```
APISIX 收集内部运行时指标,并默认通过端口 `9091` 和路径 `/apisix/prometheus/metrics` 公开这些指标。可以[在配置文件中自定义](https://docs.apiseven.com/hub/prometheus/configuration.md#%E9%9D%99%E6%80%81%E9%85%8D%E7%BD%AE)端口和路径。
ADC 会将全局规则导出为一个以插件名为键的 map。导出内容不会保留原始规则 ID,也不会保留哪些插件曾归属于同一条规则。如果多条规则配置了同一个插件,导出结果只会保留一份配置。需要保留原始规则 ID 或分组时,请使用本节的 Admin API 标签页。
导出当前全局规则:
```
adc dump -o adc-global-rules.yaml \
--include-resource-type global_rule
```
警告
ADC dump 可能包含 Admin API 返回的已解密敏感字段。请限制对导出文件的访问,并在完成变更后将其删除。
编辑导出的文件,在保留其他所有插件条目的同时添加 Prometheus 插件:
adc-global-rules.yaml (global\_rules excerpt)
```
global_rules:
# Keep every other global plugin entry from the exported file.
prometheus: {}
```
预览全局规则,并确认差异中没有无关的插件变更或删除:
```
adc diff -f adc-global-rules.yaml \
--include-resource-type global_rule
```
同步已审查的全局规则:
```
adc sync -f adc-global-rules.yaml \
--include-resource-type global_rule
```
APISIX 收集内部运行时指标,并默认通过端口 `9091` 和路径 `/apisix/prometheus/metrics` 公开这些指标。可以[在配置文件中自定义](https://docs.apiseven.com/hub/prometheus/configuration.md#%E9%9D%99%E6%80%81%E9%85%8D%E7%BD%AE)端口和路径。
向 `/apisix/prometheus/metrics` 路径发送请求,从 APISIX 获取指标:
```
curl "http://127.0.0.1:9091/apisix/prometheus/metrics"
```
你应该看到类似以下的指标列表:
```
# HELP apisix_etcd_modify_indexes Etcd modify index for APISIX keys
# TYPE apisix_etcd_modify_indexes gauge
apisix_etcd_modify_indexes{key="consumers"} 0
apisix_etcd_modify_indexes{key="global_rules"} 0
apisix_etcd_modify_indexes{key="max_modify_index"} 16
apisix_etcd_modify_indexes{key="prev_index"} 15
apisix_etcd_modify_indexes{key="protos"} 0
apisix_etcd_modify_indexes{key="routes"} 16
apisix_etcd_modify_indexes{key="services"} 0
apisix_etcd_modify_indexes{key="ssls"} 0
apisix_etcd_modify_indexes{key="stream_routes"} 0
apisix_etcd_modify_indexes{key="upstreams"} 0
apisix_etcd_modify_indexes{key="x_etcd_index"} 16
# HELP apisix_etcd_reachable Config server etcd reachable from APISIX, 0 is unreachable
# TYPE apisix_etcd_reachable gauge
apisix_etcd_reachable 1
...
# HELP apisix_http_status HTTP status codes per service in APISIX
# TYPE apisix_http_status counter
...
```
## 配置 Prometheus[](#配置-prometheus "配置 Prometheus的直接链接")
在 Prometheus 中,目标是 Prometheus 抓取指标的端点。可以将 APISIX 指标端点配置为 Prometheus 目标,以便从中收集指标。
创建配置文件 `prometheus.yml`:
```
cat > prometheus.yml <<'EOF'
global:
scrape_interval: 15s
scrape_configs:
- job_name: apisix
metrics_path: /apisix/prometheus/metrics
static_configs:
- targets:
- apisix-quickstart:9091
EOF
```
创建数据卷并启动 Prometheus。主机上的端口 `9092` 映射到容器内端口 `9090` 上的 Prometheus Web 界面:
```
docker volume create apisix-quickstart-prometheus-data
docker run -d --name apisix-quickstart-prometheus \
--network apisix-quickstart-net \
-p 9092:9090 \
-v "$(pwd)/prometheus.yml:/etc/prometheus/prometheus.yml:ro" \
-v apisix-quickstart-prometheus-data:/prometheus \
prom/prometheus:v3.7.3
```
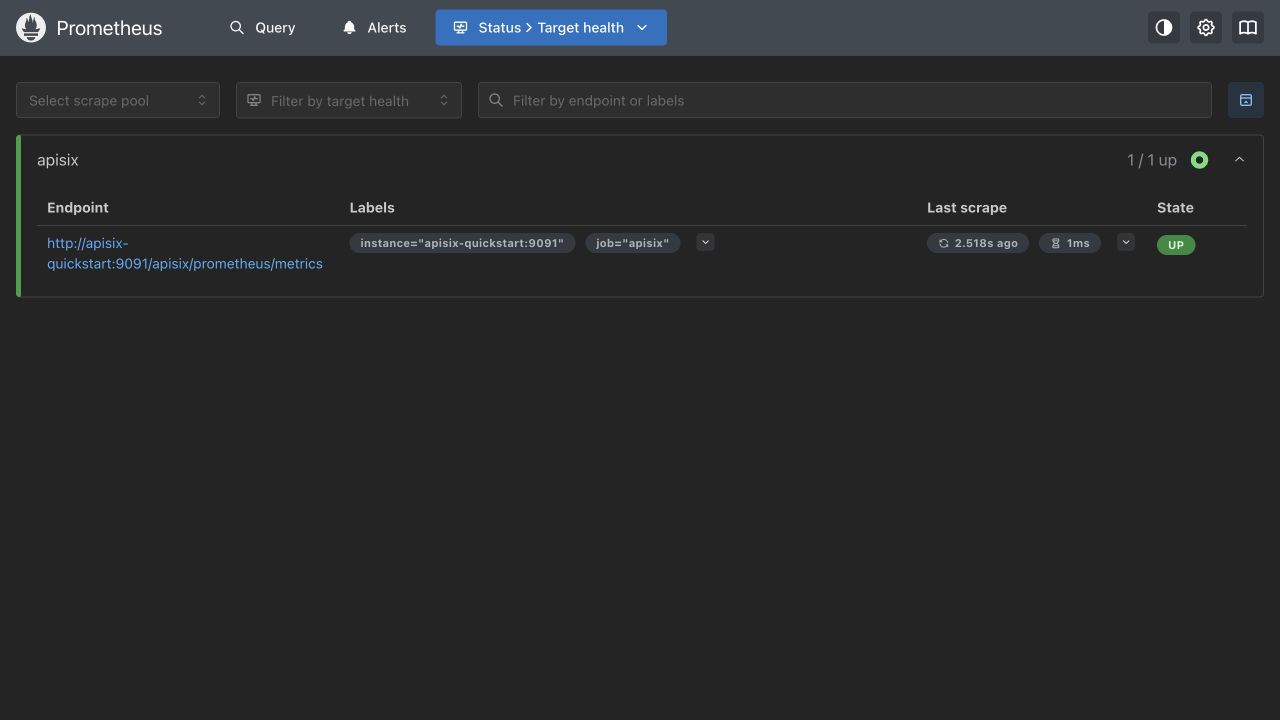
打开 Prometheus [目标页面](http://127.0.0.1:9092/targets)。`apisix` 目标的状态应为 `UP`。
## 配置 Grafana[](#配置-grafana "配置 Grafana的直接链接")
Grafana 可以可视化 Prometheus 中保存的指标。
创建数据卷,并在同一个 Docker 网络上启动 Grafana:
```
docker volume create apisix-quickstart-grafana-data
docker run -d --name apisix-quickstart-grafana \
--network apisix-quickstart-net \
-p 3000:3000 \
-v apisix-quickstart-grafana-data:/var/lib/grafana \
grafana/grafana:13.1.0
```
打开 [Grafana](http://127.0.0.1:3000),使用默认用户名和密码 `admin` 登录,并按提示修改密码。
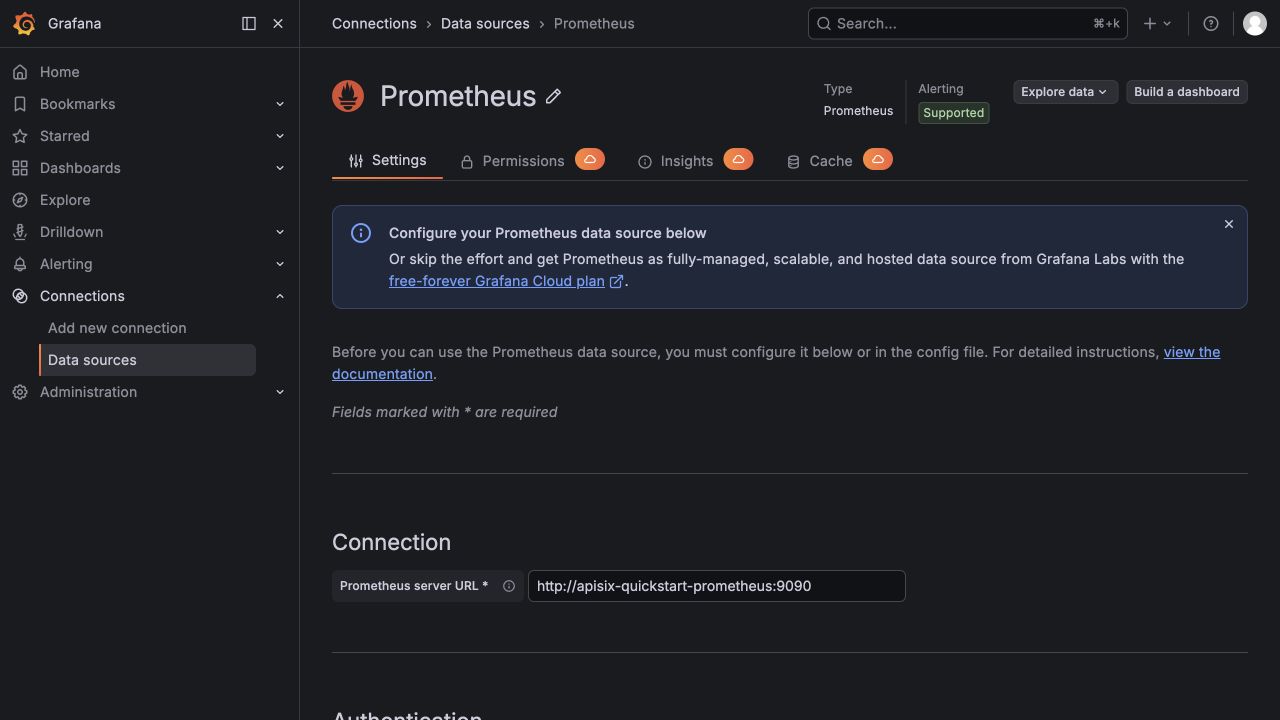
前往 **Connections > Data sources**,添加 Prometheus 数据源,并将其 URL 设为 `http://apisix-quickstart-prometheus:9090`。由于 Grafana 从 Docker 网络内部发起请求,该 URL 使用 Prometheus 容器名称和容器端口。选择 **Save & test**,确认 Grafana 能够查询 Prometheus。
生成网关流量,并等待 Prometheus 完成一次抓取:
```
for i in {1..100}; do
curl -sS "http://127.0.0.1:9080/ip" > /dev/null
done
sleep 15
```
下载 Apache APISIX 源代码树中为此版本维护的 Dashboard:
```
curl -fL "https://raw.githubusercontent.com/apache/apisix/3.20.0/docs/assets/other/json/apisix-grafana-dashboard.json" \
-o apisix-grafana-dashboard.json
```
备注
Grafana 目录中的 [Dashboard 11719](https://grafana.com/grafana/dashboards/11719-apache-apisix/) 页面只列出了对 APISIX 2.10.x 的兼容性,并依赖旧版 Grafana 面板。对于本指南公开的指标,请使用上面的版本化 Dashboard JSON。
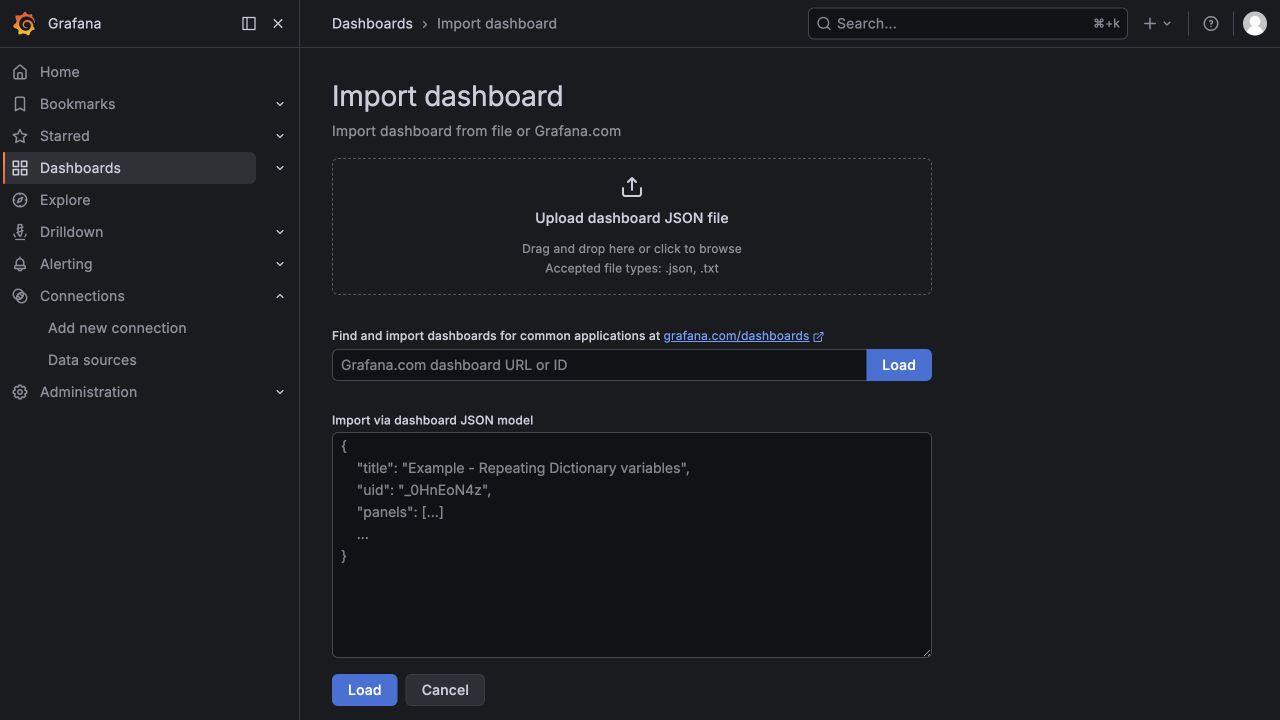
在 Grafana 中前往 **Dashboards > New > Import**,上传 `apisix-grafana-dashboard.json`,选择 Prometheus 数据源,然后选择 **Import**。
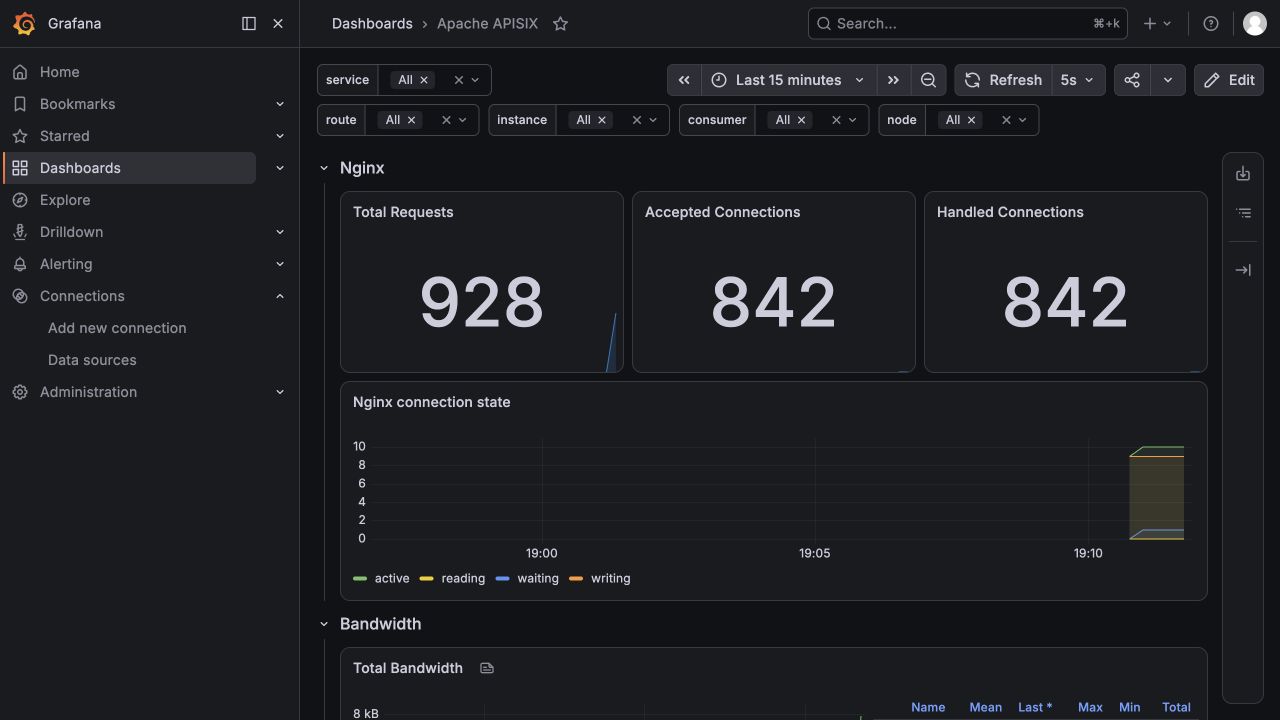
Dashboard 应显示上面生成的请求,并展示 APISIX 连接、请求、延迟、带宽、etcd 和共享字典指标。
如果你已抓取 `apisix_llm_latency`,请更新遗漏 `type` 标签的 PromQL、记录规则和 Grafana 面板。该直方图现在将 `type="total"`(完整响应延迟)与 `type="ttft"`(流式请求的首 Token 时间)区分开来;不带 `type` 的选择器会同时匹配二者。需要保持此前的总延迟语义时,请使用 `type="total"`:
```
histogram_quantile(0.99, sum by (le, route_id) (rate(apisix_llm_latency_bucket{type="total"}[5m])))
```
每个流式请求会记录一个 `total` 观测值和一个 `ttft` 观测值,因此流式流量的样本数和时间序列基数都会增加。
## 降低指标基数[](#降低指标基数 "降低指标基数的直接链接")
高基数标签(例如频繁变化的上游节点地址)会产生大量时间序列。可配置 `prometheus` 插件元数据,将所选标签值替换为空字符串,同时保留指标架构中的标签:
```
curl "http://127.0.0.1:9180/apisix/admin/plugin_metadata/prometheus" -X PUT \
-H "X-API-KEY: ${ADMIN_API_KEY}" \
-d '{
"disabled_labels": {
"http_status": ["node"],
"http_latency": ["node"]
}
}'
```
生成流量后再次获取指标端点。受影响的时间序列仍应保留 `node` 标签,但其值为空:
```
apisix_http_status{code="200",route="1",matched_uri="/ip",matched_host="",service="",consumer="",node="",request_type="traditional_http",request_llm_model="",llm_model="",response_source="upstream"} 100
```
APISIX 会拒绝禁用用于区分不同测量值的结构化标签,例如 HTTP 状态的 `code`,以及延迟和带宽的 `type`。各指标支持的标签请参阅 [`prometheus` 插件元数据参考](https://docs.apiseven.com/hub/prometheus/configuration.md#plugin-metadata)。
## 监控 TCP 和 UDP 流量[](#监控-tcp-和-udp-流量 "监控 TCP 和 UDP 流量的直接链接")
启用流代理,并将 `prometheus` 添加到现有 `stream_plugins` 列表。下面的最小列表足以用于本示例;请保留部署中使用的其他流插件:
config.yaml
```
apisix:
proxy_mode: http&stream
stream_proxy:
tcp:
- 9100
stream_plugins:
- prometheus
```
重新加载 APISIX,然后创建一个流路由:
```
curl "http://127.0.0.1:9180/apisix/admin/stream_routes" -X PUT \
-H "X-API-KEY: ${ADMIN_API_KEY}" \
-d '{
"id": "prometheus-stream-route",
"plugins": {
"prometheus": {}
},
"upstream": {
"type": "roundrobin",
"nodes": {
"httpbin.org:80": 1
}
}
}'
```
通过流监听器发送流量,并抓取指标端点:
```
curl -i "http://127.0.0.1:9100"
curl "http://127.0.0.1:9091/apisix/prometheus/metrics" | grep apisix_stream
```
输出应包含连接总数、活跃会话、终止状态和带宽计数器:
```
apisix_stream_connection_total{route="prometheus-stream-route",service="",service_id=""} 1
apisix_stream_active_connections{listen_addr="0.0.0.0:9100",service="",service_id=""} 0
apisix_stream_status{code="200",listen_addr="0.0.0.0:9100",service="",service_id="",node="54.237.103.220:80"} 1
apisix_stream_bandwidth{listen_addr="0.0.0.0:9100",service="",service_id="",type="ingress",side="downstream"} 78
```
此示例中的流路由不属于任何服务,因此 `service` 和 `service_id` 为空。上游地址和字节数取决于请求。请求关闭后,活跃会话值为 `0`。活跃会话和带宽指标使用 `nginx_config.stream.metrics_zone_size` 配置的共享内存大小,默认值为 `1m`。
服务标签会改变现有流指标序列的标识。要保留忽略服务维度的聚合结果,请在求和时排除新增的标签:
```
sum without (service, service_id) (apisix_stream_connection_total)
```
## 区分 WebSocket 会话与 HTTP 延迟[](#区分-websocket-会话与-http-延迟 "区分 WebSocket 会话与 HTTP 延迟的直接链接")
WebSocket 成功升级后,HTTP 状态、延迟和带宽指标使用 `request_type="websocket"` 标签,不会归入 `traditional_http`。请求延迟包含升级后连接的整个生命周期,而不是一次短暂的 HTTP 往返。
例如,以下 PromQL 查询按路由计算普通 HTTP 请求延迟的第 95 百分位:
```
histogram_quantile(
0.95,
sum by (le, route) (
rate(apisix_http_latency_bucket{type="request",request_type="traditional_http"}[5m])
)
)
```
如需包含 HTTP 和 AI 请求但排除 WebSocket 会话,请将请求类型匹配器替换为 `request_type!="websocket"`。升级时请检查 Dashboard、告警和记录规则中的选择器,包括此前将 WebSocket 升级计为普通 HTTP 流量的查询。
请先关闭测试 WebSocket 会话,再检查这些按请求记录的指标,因为指标会在会话结束后写入。有关完整的延迟标签,请参阅 [`prometheus` 插件参考](https://docs.apiseven.com/hub/prometheus.md#labels-for-apisix_http_latency)。
## 下一步[](#下一步 "下一步的直接链接")
现在,你已了解如何使用 Prometheus 监控 APISIX 指标,并在 Grafana 中将其可视化。有关更多配置选项,请参阅 [`prometheus`](https://docs.apiseven.com/hub/prometheus.md) 插件文档。